GroweLab · Features · Education analytics & reporting

Make confident decision-making the norm with advanced education analytics.

Connect adult growth data to student outcomes data for clarity about the impact and ROI of instructional coaching, all in a single, user-friendly reporting dashboard.

Two district leaders reviewing a GroweLab analytics dashboard
40 → 4Hours of reporting
One dashboardAdult growth and student outcomes together
Easy-to-read analytics and impact reporting

No more fragmented information, scattered spreadsheets and disconnected data points.

With analytics and simple reporting in GroweLab, school and district leaders get data-informed insight into:

  • Which teachers are growing and which need additional support
  • The correlation between coaching and educator growth
  • The progression of educators’ skill attainment over time
  • The impact of coaching on teacher retention and student outcomes
Take the guesswork out of decision-making

Customizable reports and easy-to-digest visuals.

GroweLab turns adult and student data points into reports leaders can act on.

At-a-glance progress reports

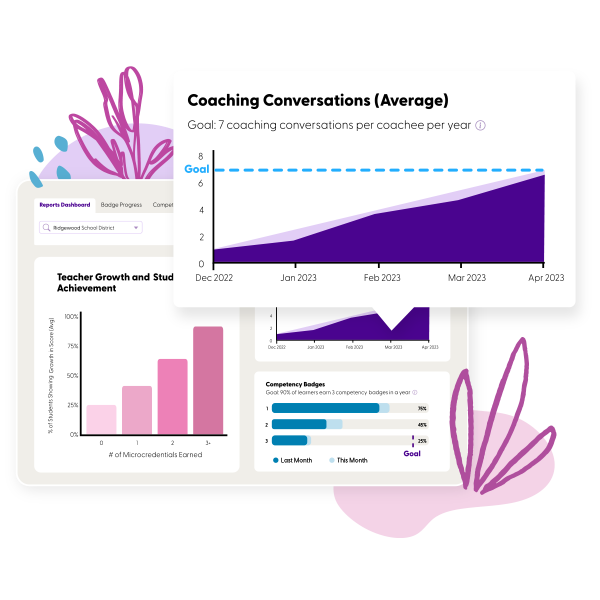
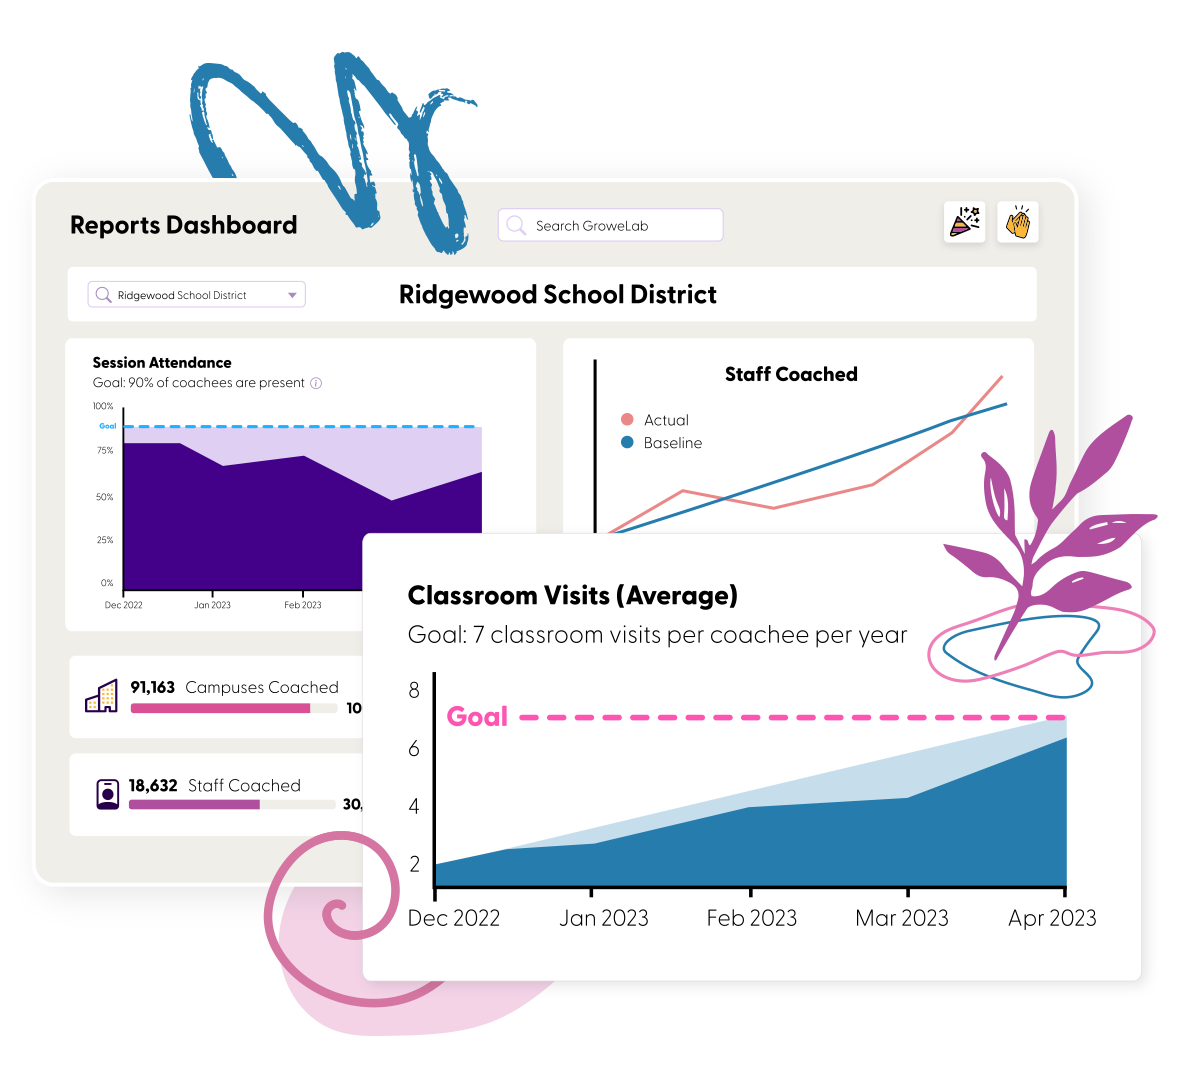
Get a bird’s-eye view of coaching and growth trends across your school or district: the volume of coaching conversations, the frequency of classroom visits, how engaged educators are in the process, and how much growth is happening as a result.
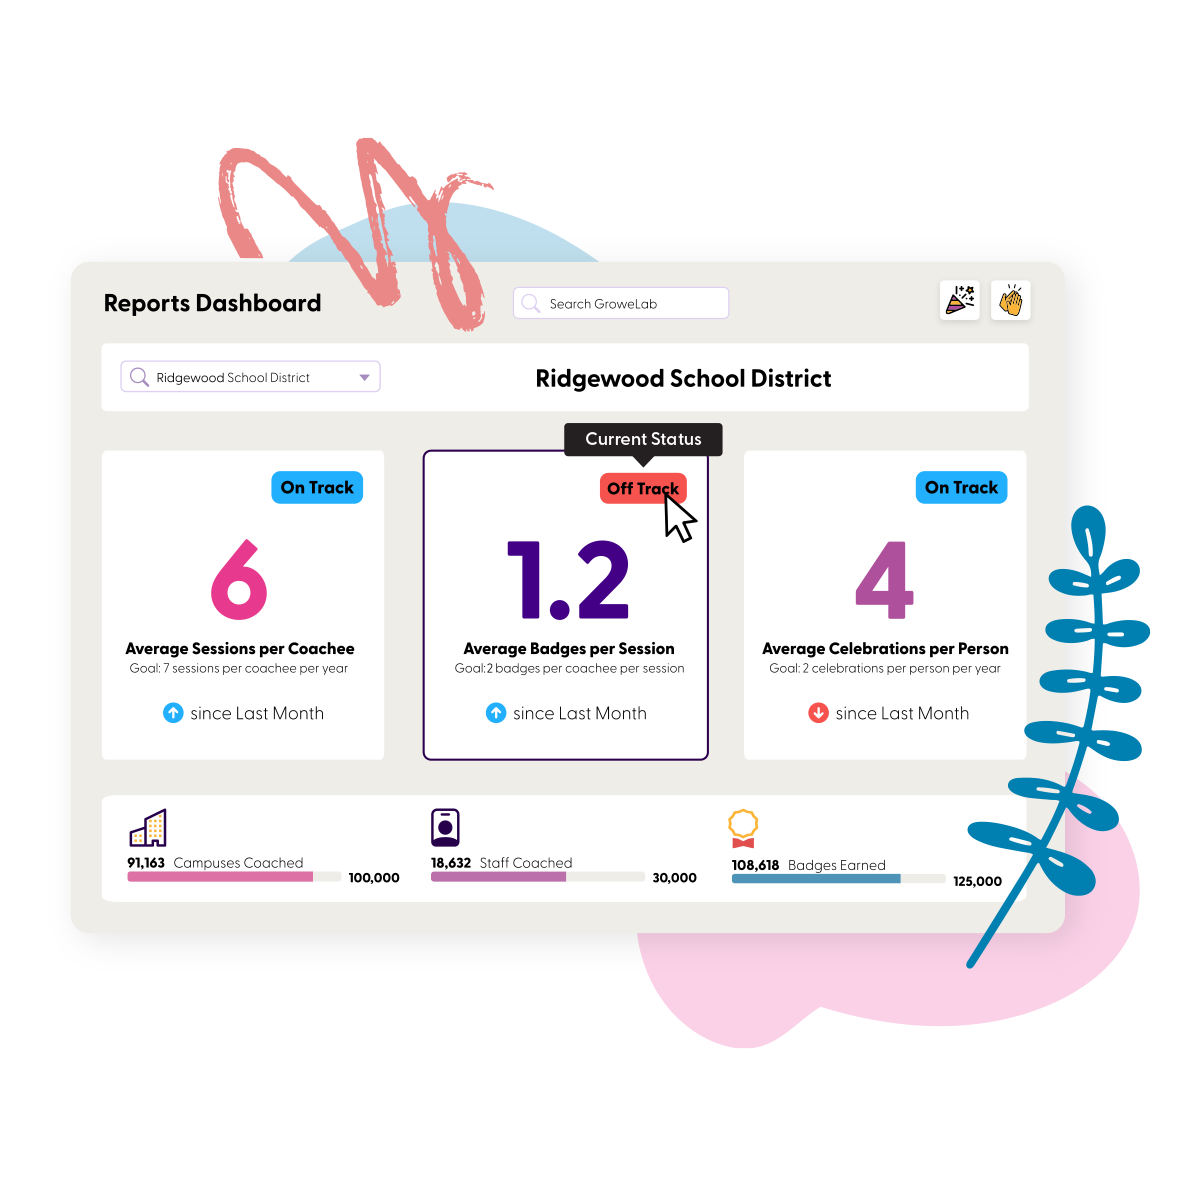
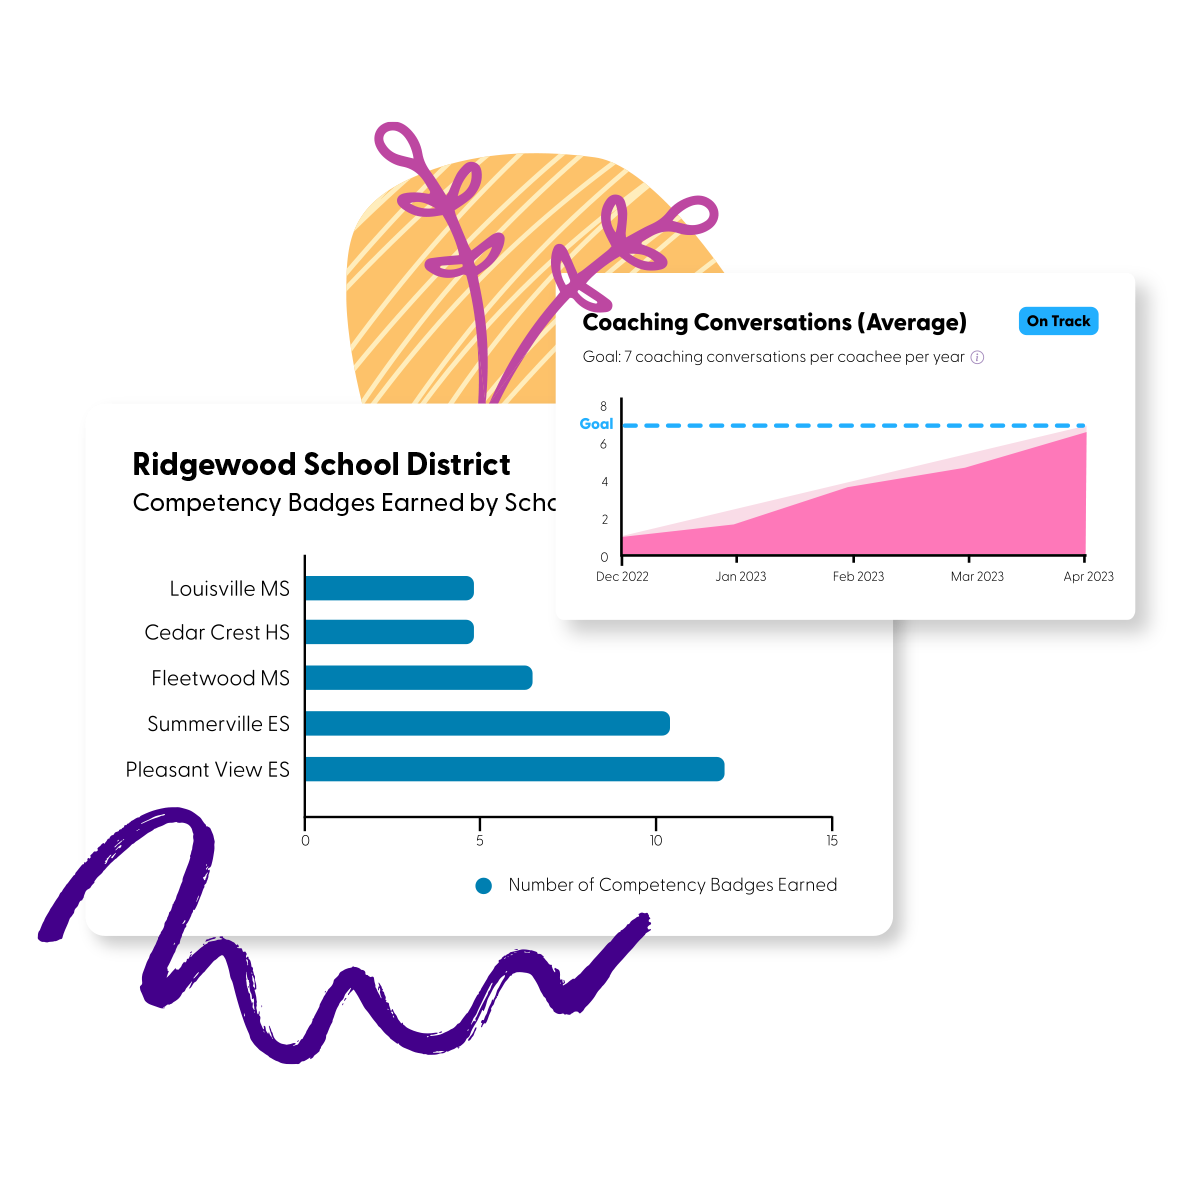
A GroweLab at-a-glance report: coaching conversations, classroom visits, engagement and growth across a district

District-to-school drill-downs

Use filters to drill high-level data down into specific subsets, for detailed intel on which growth trends to celebrate and which learning gaps to address at the competency, school, cohort and individual teacher level.

GroweLab report filters drilling district data down to a school, a cohort and a teacher

Student impact reports

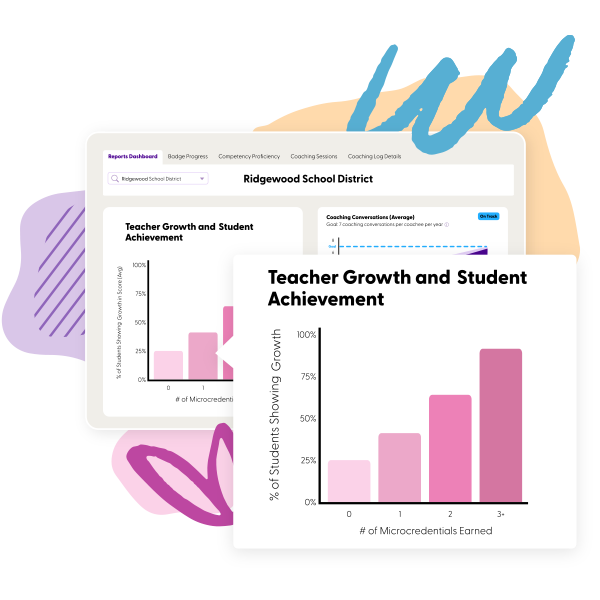
Upload any external data, such as NWEA MAP scores, graduation rates or retention rates, directly into GroweLab to connect student outcomes to educator growth. Leaders see the direct impact of coaching on teacher, student and school outcomes, and report the ROI of coaching to stakeholders.

A GroweLab student-impact report connecting badges earned to imported student outcome data

Coaching reports

Stay in the loop on coaching activity with filtering and reporting on individual coaching sessions, coachee engagement scoring, month-over-month coaching activity comparisons and more.

Coaching features
A GroweLab coaching report with session counts, coachee engagement scores and month-over-month comparison

Competency proficiency reports

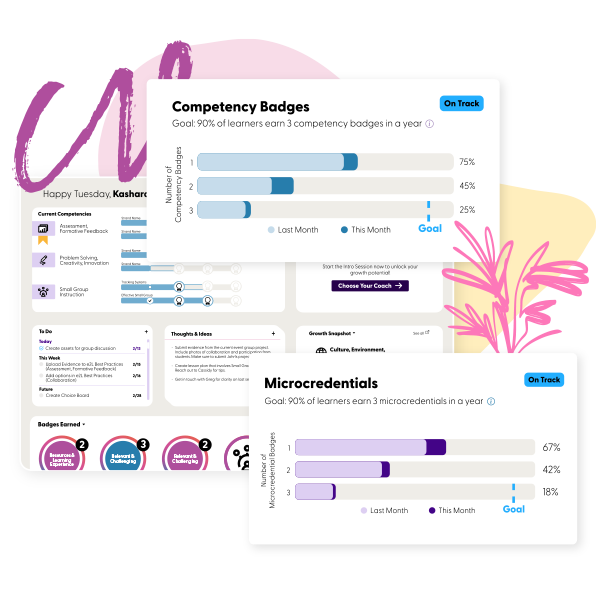
As teachers engage in coaching and earn badges and microcredentials, GroweLab creates proficiency reports that help leaders measure skill acquisition at the teacher, grade, cohort, school or district level.

Microcredentials & badging
A GroweLab competency proficiency report by teacher, grade and school

Observation and walkthrough reports

As coaches complete evaluation and classroom walkthrough forms, leaders turn those qualitative observations into quantitative, measurable data, for clarity on teachers’ growth aligned to their goals and the district’s priorities.

Classroom observations
A GroweLab observation report summarizing visits by time, frequency and observed behavior
Connect adult and student data

Measure the direct impact of coaching on district goals.

  1. Step 1

    Monitor teacher growth data

    Monitor teacher progress in GroweLab, recognize and encourage continued growth, and address areas that need improvement as they come up through the year.

  2. Step 2

    Import student performance data

    Import external student data, such as NWEA MAP scores and attendance rates, at the beginning, middle and end of the year.

  3. Step 3

    Analyze adult and student data together

    Analyze educator growth data alongside student outcomes data to show the connection between teacher coaching and learner achievement.

  4. Step 4

    Celebrate and recognize growth

    Celebrate individual and collective growth, identify gaps or challenge areas, work with your team on ways to close them, and repeat.

Time back

Less time building reports, and more time acting on them.

40 → 4
hours: the reporting that took 40 hours becomes 4
3 to 6
other professional learning tools replaced by one platform
In their words

Leaders who can see the whole district.

With this data in my hands, I can change the world.
Executive Director, Dallas ISD
“GroweLab gives me a quick snapshot. There is no way to be in all of the schools, but we can use GroweLab to see a high level overview of what is happening in the district.”
District leader, GroweLab user
Where this sits in the cycle

The dots, connected.

Analytics in GroweLab run through every step of the cycle. They show which skills moved in which schools as practice changes, and they carry the plan, the coaching and the community work that follow.

  1. You are here 01

    Diagnose

    Reports show which skills moved in which schools, and how coaching connects to student outcomes.

    Assessments & Software
  2. You are here 02

    Design

    The plan’s priorities carry owners and progress on the same dashboard.

    Planning & Design
  3. You are here 03

    Coach

    Coaching reports show session volume, engagement and growth, coach by coach.

    Performance Improvement
  4. You are here 04

    Connect to community

    Leaders bring their reports to peers in the Jim Knight Impact Network.

    Network & Events
40 → 4 hours of reporting
3 to 6 other professional learning tools replaced
See how the whole cycle runs
Not sure where to start? Answer seven questions to find the answer to your Improvement Equation. Find my pathway
FAQ

Questions leaders ask.

What does GroweLab report on?

GroweLab reports on coaching activity, classroom visits, educator engagement, competency proficiency, badges and microcredentials, observation data and, with imported student data, the connection between educator growth and student outcomes, all in one dashboard.

Can we connect coaching data to student outcomes?

Yes. Upload external data such as NWEA MAP scores, graduation rates, attendance or retention rates directly into GroweLab, and analyze it alongside educator growth data to see and report the impact of coaching on teacher, student and school outcomes.

How far can leaders drill down?

From the district to the competency, school, cohort and individual teacher. Filters turn high-level trends into specific data subsets, so leaders know which growth to celebrate and which learning gaps to address.

How much time does reporting take?

Far less than it did. With coaching, observation and growth data already connected in GroweLab, reporting that took 40 hours becomes 4.

Ready to see the impact of coaching across your district?

Your growth data, beside your student data.

Bring one student data set, and we’ll show you GroweLab’s analytics with your coaching and growth data beside it.

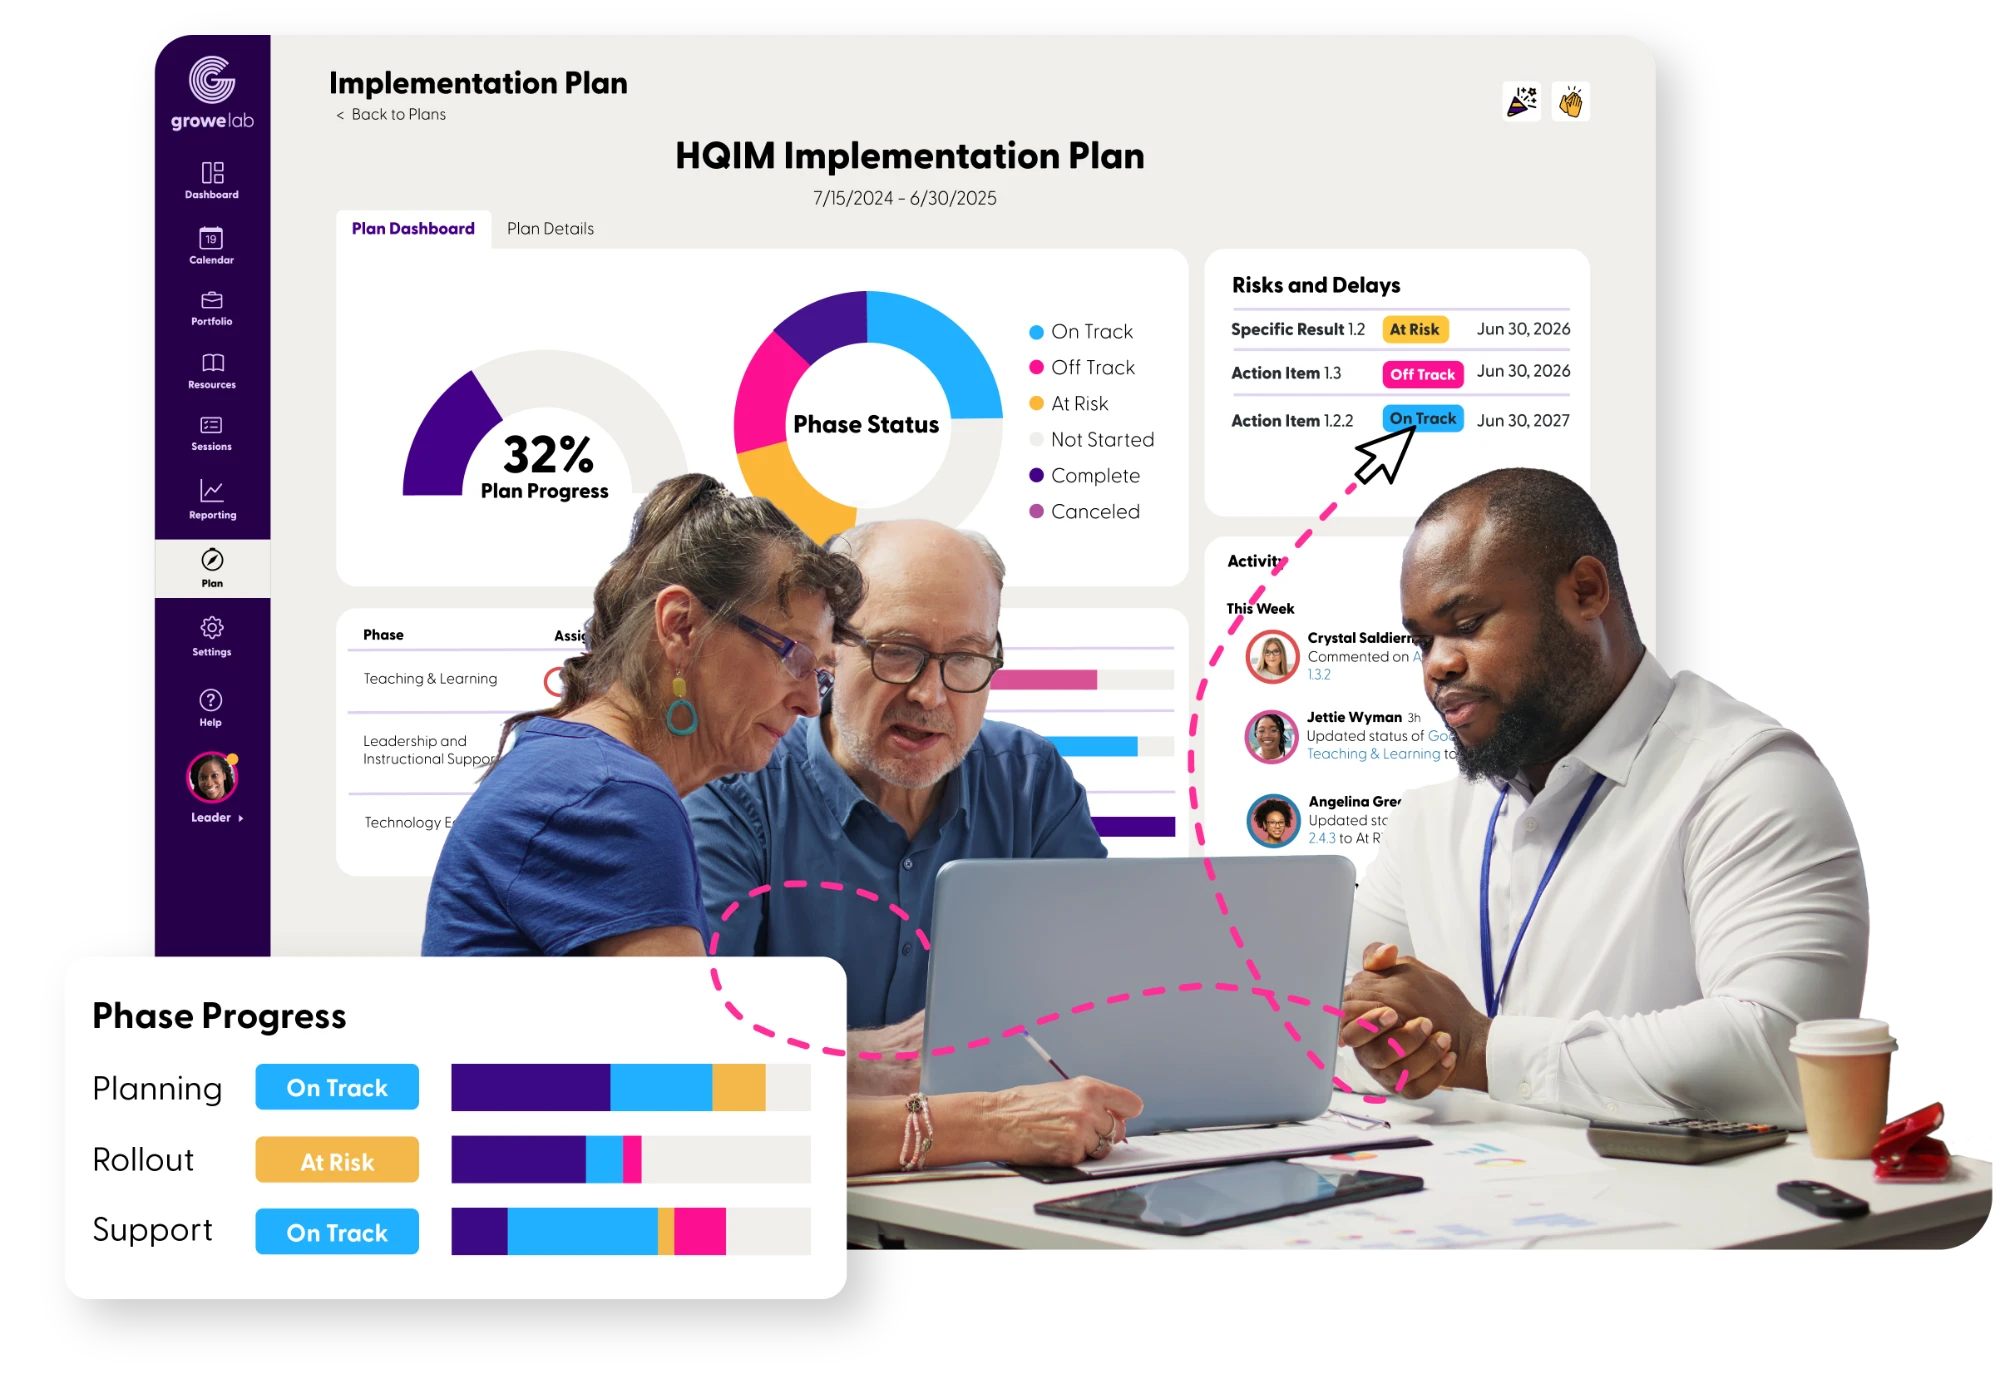
Three educators plan together at a laptop in front of a GroweLab HQIM implementation plan showing 32 percent plan progress, phase status, risks and delays, and phase progress for planning, rollout and support